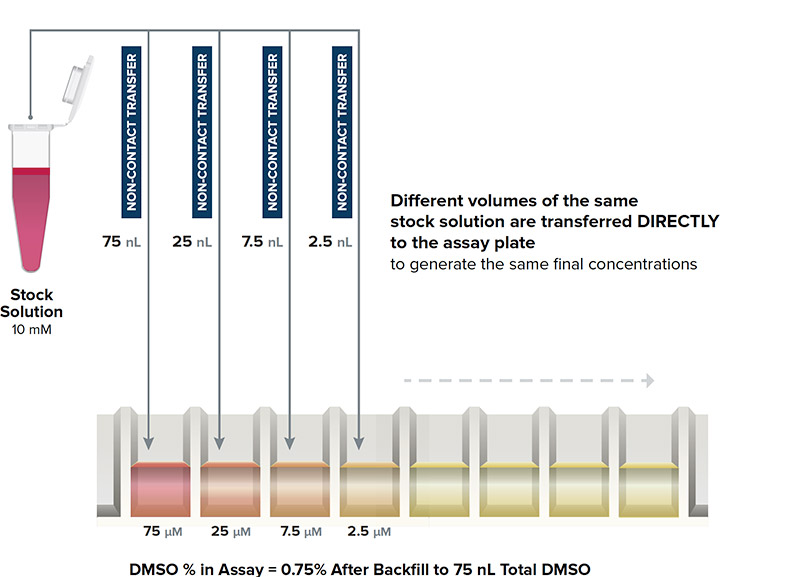
DIRECT DILUTION
Different volumes of the same stock solution are transferred directly to the assay plate
The generation of IC50 or EC50 data is a key component of drug discovery processes. The setup of IC50 curves have traditionally been a liquid handling challenge that is prone to error. The use of the Echo Liquid Handler eliminates these errors, enabling discoveries that would have been missed by other methods. By coupling the Echo Liquid Handler with Labcyte Automation and Echo Software Applications, IC50 data is generated more accurately and more efficiently than traditional methods.
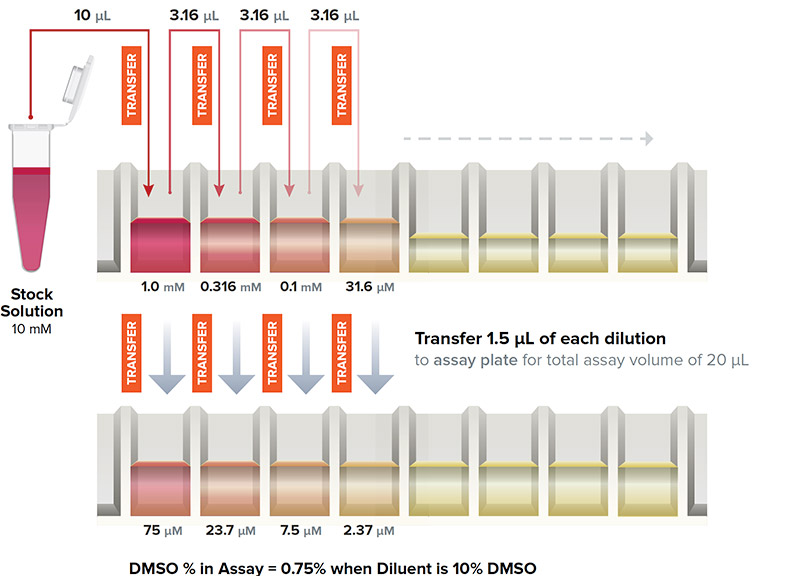
Traditional Serial Dilution Workflow
- Sample loss may occur on tips
- Potential for leachates and cross-contamination from tips
- Compounding errors may occur with the serial nature of the transfer
Echo Direct Dilution Workflow
- Solutions are never in contact with a pipette tip
- Eliminates any potential for both leachates and cross-contamination
- Sample is transferred DIRECTLY to the assay wells
Traditional Method: Serial Dilution
Traditionally, scientists have approached the generation of IC50 data in similar manners. Starting with a high concentration of drug in DMSO or buffer, they create their initial stock and then dilute across a series of wells. A small amount of the high concentration well is transferred to the next well, containing buffer or solvent. The process is repeated, resulting in each successive well at a concentration increment lower than the previous well. As this technique has been the only available approach to IC50 curve generation, the inherent drawbacks for this method are not often considered. The risks in this technique include:
Error Propagation
Small errors in pipetting are exacerbated by a serial dilution process. A 10% error in pipetting accuracy or precision could result in a 40-fold concentration error at the opposite end of a 12-point IC50 curve.
Tip Contact
Plastic disposable tips in contact with samples has been shown to result in interference with an assay.
Compound Precipitation
Many serial dilution techniques start with a compound in DMSO diluted into buffer. As this first step is the highest concentration of compound, the change in buffer solution could cause material to precipitate out of solution. Subsequent dilution of the first sample in a serial dilution method may transfer the compound at a far lower concentration than anticipated.
Compound Waste
To avoid the above scenario, some will serially dilute compound into the same storage solution (usually DMSO). The generated IC50 curve DMSO is then added in smaller volumes to an assay. While this method reduces the risk of compound precipitation, it usually requires far higher volumes of compound to be used in order to produce the full curve. This results in waste of compounds that may be unique or not readily available, and increased DMSO waste and disposal costs.
Major drawbacks of error in the serial dilution process are readily apparent. Each risk may result in compounds appearing to be less potent in a screening method. For example, in an inhibition study, the errors in a serial dilution process may cause the researcher to incorrectly rank factors causing potency, dismiss potential drug candidates, or dismiss entire classes of compounds that may be potential drug candidates. In ADME Tox studies, serial dilution process errors may result in compounds appearing less toxic, resulting in the carrying forward of a drug candidate that is destined to fail trials. As there is so much at stake in the IC50 curve generation process, it is key that the experiment is set up correctly.
| Desired Concentration | Intermediate Plate Volume | Destination Plate Volume | DMSO Backfill | Final Volume |
|---|---|---|---|---|
| 10 µM | 0 nL | 75 nL | 0 nL | 75 nL |
| 3.3 µM | 0 nL | 25 nL | 50 nL | 75 nL |
| 1 µM | 0 nL | 7.5 nL | 67.5 nL | 75 nL |
| 0.33 µM | 0 nL | 2.5 nL | 72.5 nL | 75 nL |
| 100 nM | 250 nL stock + 24.75 µL DMSO | 75 nL | 0 nL | 75 nL |
| 33.3 nM | 250 nL stock + 24.75 µL DMSO | 25 nL | 50 nL | 75 nL |
| 10 nM | 250 nL stock + 24.75 µL DMSO | 7.5 nL | 67.5 nL | 75 nL |
| 3.3 nM | 250 nL stock + 24.75 µL DMSO | 2.5 nL | 72.5 nL | 75 nL |
| 1 nM | 2.5 nL stock + 25 µL DMSO | 75 nL | 0 nL | 75 nL |
| 0.33 nM | 2.5 nL stock + 25 µL DMSO | 25 nL | 50 nL | 75 nL |
| 0.1 nM | 2.5 nL stock + 25 µL DMSO | 7.5 nL | 67.5 nL | 75 nL |
| 0.033 nM | 2.5 nL stock + 25 µL DMSO | 2.5nL | 72.5 nL | 75 nL |
In the example above, the first four concentrations are made directly from the stock source plate. The next four concentrations are made by performing a 1:100 dilution of the stock into an intermediate plate, and transferring out of that intermediate plate to the destination plate. The final three concentrations are made by performing a 1:10,000 dilution of the stock into the intermediate plate and transferring to the destination plate. As all transfers are performed in 2.5 nL increment droplets at varying numbers, precision in concentrations are not prone to the propagated error inherent in traditional serial dilutions.
Echo Software for Direct Dilution
The Echo Dose-Response application simplifies protocol creation for direct dilution. A wizard guides researchers through the mapping of transfers from stock and intermediate concentrations to create curves of varying concentration range. The entire workflow can be managed in a single protocol, and samples may originate from a single source plate or picked according to a file. The built-in simulator shows the creation of each curve for a quick verification of the transfer protocol.
Labcyte Automation systems are a proven solution for efficient, high-throughput IC50 assay production. The Access Laboratory Workstation utilizes the Tempo Automation Software to build automated routines directly from any Echo Dose-Response protocol. All plate movements and back-fill steps are automatically prioritized and scheduled by the software — not the operator.